You may have heard the phrase, “You can never be too rich, too thin, or have too much RAM.” RAM is a vital part of a computer system, providing for computer data storage via volatile memory. The current recommended amount for a new system build is 16GB of RAM, with 32GB more suitable these days for those who want to “future-proof,” or have more advanced needs, such as multitasking, CAD, or video editing. For even more advanced users, 64GB or 128GB of total system RAM may be easily justified.
Our computer systems have large amounts of RAM at their disposal, all to avoid running low on this all-important resource. A shortage of memory on a desktop will grind the system to a performance halt. This is because when the computer is running low (or out) of available RAM, it performs a process called “paging,” in which it swaps out data that’s in RAM to the storage drive. This creates virtual memory, which then allows the computer to continue its task. All of this shuttling of data back and forth between RAM and the slower virtual memory has a negative impact on performance, as you might guess.
So the recommendation is to have plenty of RAM installed, with “the more RAM, the better” being the mantra.
Despite having this overabundance of RAM in modern computers, there can still be situations where the system runs out of memory. The most obvious is simultaneously running multiple memory-hogging applications—4K video editing software, or a ridiculously large number of tabs open in a browser—that use up all available memory resources. The solution to this issue is to install more RAM, and/or have the computer run fewer programs simultaneously.
What is a memory leak?
What is a memory leak?
Despite having adequate RAM and not running resource-intensive software, there can be another situation where all available RAM gets used and performance degrades. This is known as a memory leak, and it happens when software fails to manage the available RAM correctly.
With the computer functioning normally, RAM gets used by software in a dynamic fashion, and memory resources are allocated as needed. When software no longer needs the RAM resource, it is then “returned,” so that it can be reallocated to the next program when needed. In a situation with a memory leak, RAM gets allocated to the software but is not freed up when no longer needed. It’s akin to the memory getting stuck in a roach trap—“Roaches get in, but they can’t get out.” As this continues, a large chunk or even a system’s entire complement of RAM can be tied up in this dysfunctional process.
This is ultimately caused by a software bug. For example, Windows 11’s File Explorer was recently said to cause a memory leak for some users. These are usually patched out pretty quickly, but they can be quite damaging to your PC’s performance while they’re still a problem.
What does the user experience? Unfortunately, no version of Windows flashes a popup to alert the user that a memory leak is occurring, so it’s not a simple issue to diagnose. The system can have a myriad of symptoms that point to a leak, though: decreased performance, a slowdown plus the inability to open additional programs, or it may freeze up completely. This is often exacerbated by having lots of available memory; if the leak only consumes a few MB of RAM each minute, it could be a day or two before the problem reaches the critical level.
The solutions at this point are to close the offending process in the task manager, or a system reboot, which will free up all the RAM so that the process can start again. While a reboot as a solution will get the system running again, it does not precisely diagnose the issue, nor give the user a good idea of what happened or how to avoid it happening again. It is analogous to lighting your lawn on fire just to get rid of some dandelions—too much treatment for the problem at hand.
Finding a memory leak
Tracking down a memory leak can be a difficult process. Let’s say a program runs for a brief amount of time and has a memory leak. As the process terminates, it may not be an obvious issue if there is more than adequate RAM to support other processes. However, with a longer-running program that grabs more RAM, it can eventually grab all the system’s RAM and grind your rig to a standstill.
Using Window’s Resource Monitor
To find a memory leak, you’ve got to look at the system’s RAM usage. This can be accomplished in Windows by using the Resource Monitor.
In Windows 11/10/8.1:
Press Windows+R to open the Run dialog; enter “resmon” and click OK.
With Resource Monitor open, select the Memory tab.
In Windows 7:
Start > All Programs > Accessories > System Tools > Resource Monitor

Looking at Physical Memory, start by confirming the correct amount is displayed as installed, to ensure that there isn’t a hardware issue. Now look at the amount of available memory, and the amount that’s in use. This will show if the system is running low on memory, or if there’s plenty available.

Next, we turn our attention to the processes running that are using the memory. Rather than scrolling through the whole list, you can click “Commit (KB),” which will reorder the list so that the most memory-intensive tasks appear at the top. This makes it easy to see which software is using the most RAM. In the above example it’s “Firefox.exe,” better known as the Firefox browser (for the record, there were four tabs open at the time of the screenshot). Also note that at the top of the Processes, 39 percent of physical memory was being used, indicating adequate reserves for additional processes.

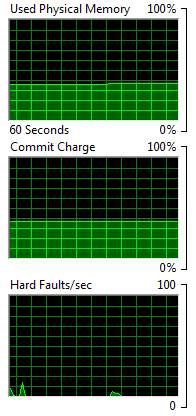
Displayed on the right side of the screen are the monitors over time, which indicate the last 60 seconds. The top panel shows the “Used Physical Memory,” and we can see that it is slightly increasing over time, but there’s still a significant portion available, allowing the system to remain stable.
Limitations of Window’s Resource Monitor
It’s certainly worthwhile to keep an eye on the Window’s Resource Monitor, as it can show the available memory and the processes that are using the most resources. However, it also has some significant limitations.
The first is that it is not continuously monitored. It requires opening the Resource Monitor, and doesn’t run continuously in the background. As an aside, Windows Gadgets, which were introduced in Windows Vista and continued in Windows 7, offered a gadget that did this. As it turned out, these gadgets were vulnerable (as most software is), so they were discontinued and are no longer available from Microsoft. While we never thought we’d pine for Vista, this was truly a useful feature that may have been dropped a little too soon.
The other limitation is that it only goes back 60 seconds. If a memory leak occurs and the software is closed, chances are it will not be caught in the act and correctly identified as the culprit.
CleanMem Mini Monitor
So, with Windows not having a robust tool to tackle the memory leak issue, we turn our attention to a third-party software solution. It’s called CleanMem Mini Monitor, which you can download here.

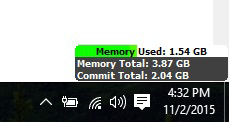
CleanMem Mini Monitor is designed to sit just above the Windows System Tray in the lower right-hand corner. It’s flexible, and can be toggled on and off. This is useful, because it provides real-time status of total memory and the amount that is committed to running processes. As software is opened and closed, it’s useful to be able to see how the RAM that is used is impacted, and also to see when there’s little or no free memory available. This can also be used as a guide in your decision of whether you need to purchase additional RAM for your rig.

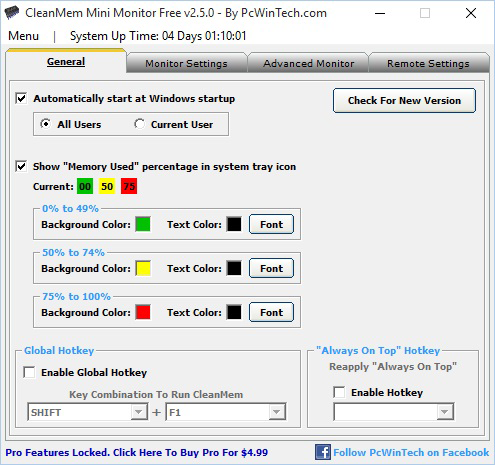
In the general tab of CleanMem Mini Monitor, you can choose to run the program automatically at system startup. The background colors of green for 0–50 percent usage, yellow for 50–75 percent usage, and red for greater than 75 percent usage give a good visual indication of the RAM that’s being used, and if it’s getting critically low.

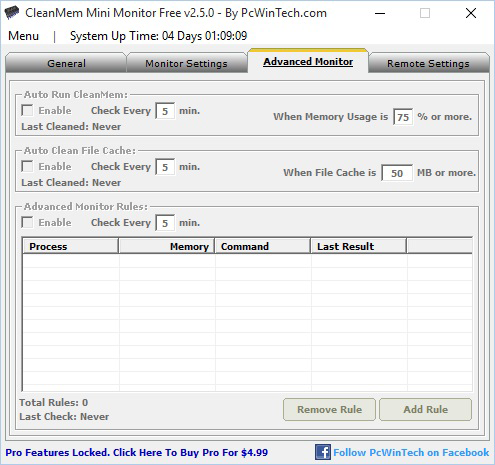
In the free version of the program, the Advanced Monitor settings are locked and not user configurable. However, they do give insight into what CleanMem Mini Monitor is doing. We can see that it is set to Auto Run every five minutes when memory usage is 75 percent or more. It’s also set to Auto Clean the file cache every five minutes when the file cache is 50MB or more. While this is generally used as a set-it-and-forget-it program, you can right click the program and run it manually as needed, too.
The more you know about what to look for and how to deal with memory leaks, the better. While CleanMem will not eliminate every memory leak issue, it does a good job of getting committed memory back to available status. While a full system reboot is the ultimate solution for RAM that is erroneously misallocated, you can improve your system stability with CleanMem, and make the reboot solution much less common.
The permanent solution of course is to get software updates for any applications or drivers that happen to have a memory leak, fixing the problem. In an ideal world, leaks wouldn’t happen, but with software becoming increasingly complex, sometimes things are missed. Often, a leak will simply result in the offending application crashing (this has happened with many games where playing for hours ultimately leads to a crash-to-desktop, at which point the memory is reclaimed), but there are many other factors that can also come into play. If you’re routinely getting “out of memory” errors, however, keep an eye on your memory usage using the above tools and you will likely discover a leak that needs to be plugged.

