
Alexey Borisov, Lead Esports Editor at Esports Charts, writes for Esports Insider to break down which metrics are most important for evaluating event performance.
Viewership statistics have become an integral part of modern esports. We constantly hear about one tournament surpassing another, a particular series continuing to grow its audience, or a tournament operator experiencing a sharp decline in viewership. Typically, these conclusions are drawn from basic metrics. However, in reality, analysing audience data is a complex task that requires attention to detail.
Why is it incorrect to compare some tournaments based on a single metric? What do we really mean when talking about the popularity of an event? How do we measure that popularity? What are the nuances of viewership data that need to be understood to make informed business decisions? We will briefly cover all of these questions in this article.
Keep Reading
Why ‘basic’ viewership metrics aren’t enough in 2024
The main metrics used to measure a tournament’s live performance are watch time and concurrent viewership (both peak and average). Peak viewership is a one-time metric representing the highest point of live viewer engagement, which indicates the maximum reach potential of an event.
Average concurrent viewership reflects the average audience engagement throughout the tournament. While this figure alone may not provide much insight, it becomes highly useful when combined with other metrics.
For example, when paired with airtime, you get the total content consumption. Comparing it with peak viewership can also help assess the audience’s sustained engagement throughout the event.
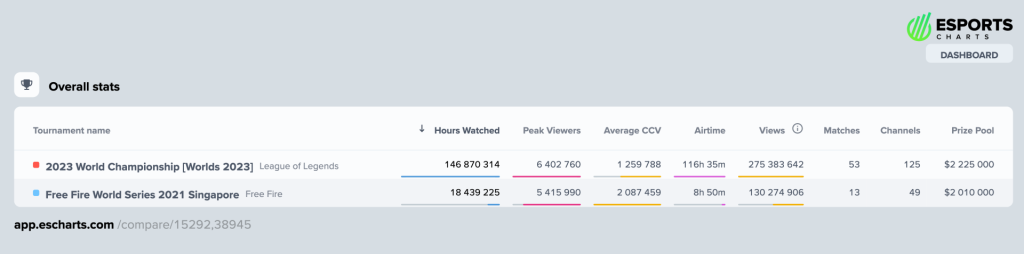
Watch time, on the other hand, represents the total amount of content consumed by viewers. It’s a useful metric for evaluating the long-term performance of tournaments, series, organisers, sponsors, and teams. Contrary to popular belief, watch time is a far more versatile metric than Views (the number of times a stream has been viewed).
The main advantage is that watch time can be consistently tracked across platforms like Twitch, YouTube, or any service that offers public viewer data. In contrast, the method for counting views differs greatly from platform to platform, making it tricky to combine them accurately (one view on one platform could count as two on another, or not at all on a third).
The key word often used to describe these metrics is ‘basic’. These are fundamental indicators that allow for comparisons and lead to broad conclusions about the popularity of certain events or teams.
However, just knowing that Tournament A is more popular than Tournament B doesn’t explain why that’s the case or how to improve the situation for the less successful one. That’s where more advanced metrics, which are often overlooked, come into play and offer much deeper insights that are valuable for the organiser or sponsor.

Why audience overlap is important
Multiple tournament operators often compete for the same audience in open or hybrid esports ecosystems like Counter-Strike and Dota 2. Even in closed ecosystems, such as the franchised League of Legends leagues, a similar dynamic can be observed, albeit in a different form.
Here, various broadcast channels ‘compete’ for viewership, whether these are different official broadcasts or community casters. Naturally, each operator aims to attract the largest possible audience, often investing significant marketing budgets to do so.
One effective way to optimise marketing spend is through understanding audience overlap, whether between specific channels or across multiple tournaments. For instance, in the case of BLAST Premier and ESL, two of the biggest tournament operators in Counter-Strike, there is significant audience overlap. Both companies have been hosting events for years and are well-established in the industry, so the average viewer is familiar with both and likely follows both.
In other words, these companies are competing for a relatively small share of the overall Counter-Strike esports fanbase, rather than the entire pool.
At the same time, the Esports Charts analytical service has encountered cases where ambitious operators, that already hosted several high-tier competitions, capture just over 10% of the audience from other tournament operators. As practice shows, even having the best teams, the most popular commentators, and high-quality visuals isn’t always enough to achieve maximum reach; it’s crucial to direct marketing efforts specifically toward attracting viewers who are already active in esports.
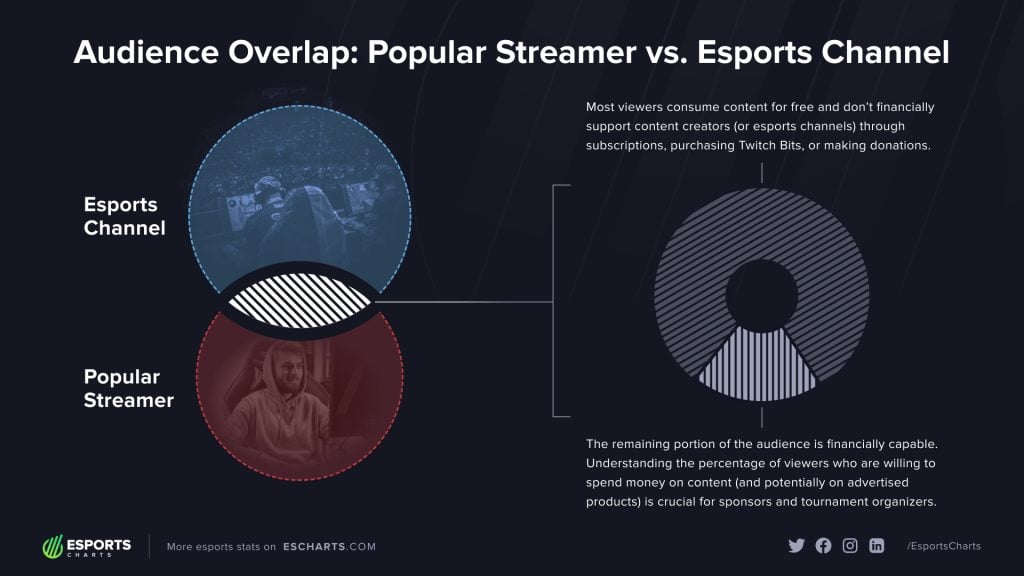
From a statistical perspective, these conclusions can be drawn not only from live tournament viewership but also by analysing audience overlap based on followers. Understanding subscriber overlap (those who pay for subscriptions) is particularly valuable as these are the viewers who not only consume content but are also financially capable, making them more likely to purchase sponsor-advertised products or services.
How long do viewers watch broadcasts?
Knowing viewer count is important, but understanding how viewers engage with the content is even more crucial. Attracting an audience is just the first step; retaining them is the next challenge. This is where the View Duration Time metric comes into play, as it indicates the average viewer engagement with the content.
View Duration Time is essentially similar to the Bounce Rate metric often used in marketing. Both help segment the audience based on how engaged they are, whether on a website or during a live stream.
For instance, the average view duration for the official broadcast of the Rocket League World Championship was 3 hours and 30 minutes, which represents about 7% of the total broadcast time. Similar results are observed across major channels for other significant esports events; due to the large influx of viewers who come and go, achieving higher engagement rates is challenging.
Streamers often have an advantage in this regard, as their audiences typically stay longer. For example, the average viewer retention on the official broadcast of BLAST Premier Spring Final was around 6% of the total event time. In contrast, this figure rose to 9% for popular Brazilian streamer Gaules, even though there were no Brazilian teams in the tournament, which usually attracts his viewers.

Using chat analytics to measure audience engagement
Another important metric for assessing user engagement with content is the chat activity, especially on platforms like Twitch. The standard viewer count during a broadcast doesn’t necessarily reflect how many people are actively engaged with the action of the event. Some viewers may be listening to it in a different tab, while others might have the stream open alongside multiple broadcasts (particularly when several major tournaments are happening at once).
Clearly, these viewers may miss critical sponsor integrations that are important for tournament organisers and/or publishers. However, the chat engagement rate provides a more accurate picture of the most active participants in the stream. If a user is chatting, they are likely watching and listening to the broadcast attentively.
Similar to view duration time, the chat engagement rate is significantly higher for streamers than for studio channels. Official channels typically show user engagement in the chat ranging from 6% to 8%, whereas top co-streamers can achieve rates exceeding 20%.
Perhaps the more crucial aspect of chat analytics relates to sponsorship integrations. Chat serves as a key tool for promoting partners’ links and announcements, making it advantageous to plan campaigns with channels that have a high chat engagement rate.
Knowing audience geography is key
Knowing the absolute numbers for tournaments is certainly important, but they only measure the overall popularity of an event and don’t reveal key details about who is watching and how — information that is crucial for organisers, teams and sponsors.
Take the well-known tournaments The International and League of Legends Worlds, for example. Both international events regularly accumulate tens of millions of hours of watch time and generally show comparable total viewership figures (although League of Legends generally performs better). However, when we dive into the demographics, the differences become more apparent.
The International typically garners the majority of its viewership from just two demographics, English-speaking and Russian-speaking audiences, which together account for about 80% of the total watch time. In contrast, Worlds does not show such dominance of one or two languages: here, 80% of viewership comes from five different languages, and the differences in content consumption among them are not as stark as in the case of The International.
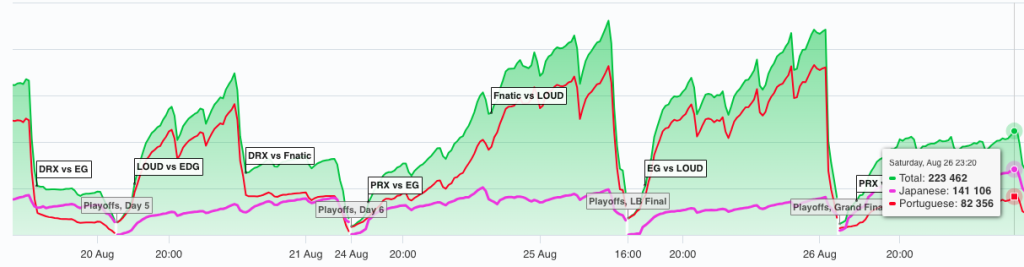
Behaviour patterns of different demographics during tournaments are also an interesting talking point, especially in the case of international events. For example, Brazilian and Asian audiences are significant demographics for Valorant events like the Masters and Champions series. While they have similar fan bases, their viewing behaviours differ: Brazilians tend to be much more active during matches featuring their compatriots, whereas Asian viewers watch the tournament more consistently and are less likely to leave streams when teams from their region are not playing.
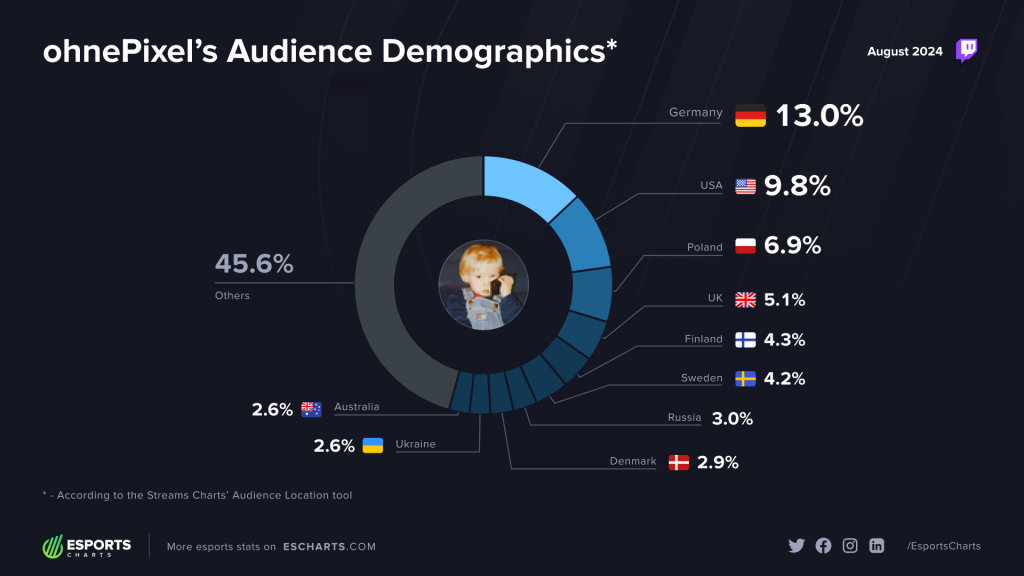
It’s also useful to clarify geolocation when discussing English-language channels. While Western Europe and North America make up the majority of viewers for most major esports events in this language group (depending on the game), there can be surprising cases. For instance, data from Streams Charts shows that one of the most popular Counter-Strike co-streamers, ohnePixel, has more viewers in the Philippines than in Slovakia, Romania, Belgium, and Spain. Additionally, he attracts more interest from Malaysians than from Italians, Serbs, and Slovaks.
In short, basic tournament viewership figures are useful knowledge, and comparing overall event metrics is reasonable for drawing general conclusions. However, relying solely on them is often insufficient, and at times even dangerous; this data is far too limited for effective decision-making. It’s crucial to analyse event performance throughout its entirety, assess the contributions of teams and various demographics to viewership, and monitor audience behaviour at different stages. The devil is in the details.
Alexey Borisov has worked in esports for over eight years, initially covering Counter-Strike. He now works as the Lead Esports Editor at Esports Charts, a platform that aggregates viewership insights about esports, sports and livestreaming.